RFM segmentation overview
RFM groups your members into a small set of named segments — Champions, Loyal, Promising, At Risk, Lost, New — by scoring three things: how Recently they last visited, how Frequently they visit, and how much Money they spend. The segments refresh every day so you always act on a current picture of your base. You use them to filter audiences, target campaigns, and read your dashboards.
RFM comes with the Smart Segmentation add-on, together with member behaviors: each member's favourite items and favourite branch. If you don't see RFM: tags in your tag picker, the add-on isn't active for your business. Ask your provider to switch it on.
RFM is the lens that turns a raw member list into a list you can act on. Instead of "5,200 members" you read "180 Champions, 920 Loyal, 410 At Risk" — and each of those points to a different kind of action.
The full per-segment definitions, who's typically in each one, and what to do (and not do) with each are on the Segments page.
Why segmentation matters
Three things change once segmentation is on:
- You know who to fight for. A Champion is worth a personalised gift on their birthday. A Lost member might be worth a single win-back message, or none at all. Without segments, you tend to treat everyone the same — which means under-rewarding your best customers and over-messaging your weakest.
- You catch members about to leave. A member who was a Champion six months ago and hasn't visited in eight weeks is At Risk. Catching them before they fully churn is the single highest-return campaign a loyalty program runs.
- You read your dashboards differently. "Revenue is up 4%" is a number. "Revenue from Champions is up 12% but At Risk is growing 20% month-over-month" is a decision.
Tuned to your kind of venue
RFM doesn't score your members against a generic average — it's calibrated to your type of business. When your program is set up, the model is matched to a venue profile (a coffee chain, fast food, casual dining, or fine dining), and that quietly changes what counts as recent, frequent, and high-spend.
It has to. A coffee regular might come in every few days; a fine-dining guest a few times a year — and both are loyal. A one-size model would flag the fine-dining guest as At Risk a month after a perfectly normal visit. The venue profile fixes that: it picks the right money measure (total spend over a shorter window for high-frequency venues; average ticket over a longer one for occasional, higher-value venues) and the right windows for how long someone stays New or counts as Lost.
The payoff: the same behaviour can land in a different segment depending on your venue — and that's deliberate. Your Champions are genuinely your Champions, and At Risk means a real risk for your business, so you can act on a segment without second-guessing it. Because it's set up for your business at launch, the segments arrive already calibrated — there's nothing for you to tune.
The four templates side by side
Each template sets three values:
| Coffee Chain | Fast Food | Casual Dining | Fine Dining | |
|---|---|---|---|---|
| Money measure | Total spend | Total spend | Average ticket | Average ticket |
| Lookback window | 6 months | 6 months | 12 months | 18 months |
| Stays New for | 30 days | 30 days | 60 days | 90 days |
It also decides which score combinations lead to which segment, so each template weighs recency, frequency and money differently:
- Coffee Chain — recency and frequency decide. A member who came in recently and comes often is a Champion, whatever they spend.
- Fast Food — almost the same, but a recent member with mid-range frequency also needs mid-range or high spend to be a Champion.
- Casual Dining — balanced. A Champion is top on at least two dimensions and no lower than the middle on the third.
- Fine Dining — average ticket decides. A recent guest with a high average ticket is a Champion even if they come rarely.
On every template, a member in the lowest recency band (the quarter of your scored members who have gone longest without a visit) is At Risk, whatever their frequency and spend.
Full score-to-segment table, per template
Every scored member gets a three-digit code: their Recency, Frequency and Monetary scores, each from 1 to 3 (see How segments are computed below). The template maps that code to a segment:
| Code (R F M) | Coffee Chain | Fast Food | Casual Dining | Fine Dining |
|---|---|---|---|---|
| 333 | Champions | Champions | Champions | Champions |
| 332 | Champions | Champions | Champions | Loyal |
| 331 | Champions | Champions | Loyal | Promising |
| 323 | Champions | Champions | Champions | Champions |
| 322 | Champions | Champions | Loyal | Loyal |
| 321 | Champions | Loyal | Promising | Promising |
| 313 | Loyal | Loyal | Loyal | Champions |
| 312 | Loyal | Loyal | Promising | Promising |
| 311 | Promising | Promising | Promising | Promising |
| 233 | Loyal | Loyal | Champions | Loyal |
| 232 | Loyal | Loyal | Loyal | Promising |
| 231 | Loyal | Loyal | Promising | Promising |
| 223 | Loyal | Loyal | Loyal | Loyal |
| 222 | Loyal | Loyal | Promising | Promising |
| 221 | Promising | Promising | Promising | Promising |
| 213 | Promising | Promising | Promising | Loyal |
| 212 | Promising | Promising | Promising | Promising |
| 211 | Promising | Promising | Promising | Promising |
| Any code starting with 1 | At Risk | At Risk | At Risk | At Risk |
The cycle: snapshot → act → re-check
RFM is not a label you assign once. It's a snapshot the platform recomputes for you every day. Three steps:
- Snapshot — once a day, the platform looks at every member's last-visit date, visit count, and spend over the lookback period, and assigns them to a segment.
- Act — you build a campaign or one-time push using the segment as the audience filter (for example, Send asset to all members tagged
RFM:atRisk). - Re-check — a few weeks later, look again. Did your At Risk members move back to Loyal? Did your Champions stay Champions? The segment they're in now is the answer.
The third step is the one most teams skip. It's also the one that tells you whether the campaign worked.
Where you'll see RFM in the Hub
RFM doesn't have one home — it shows up wherever members do:
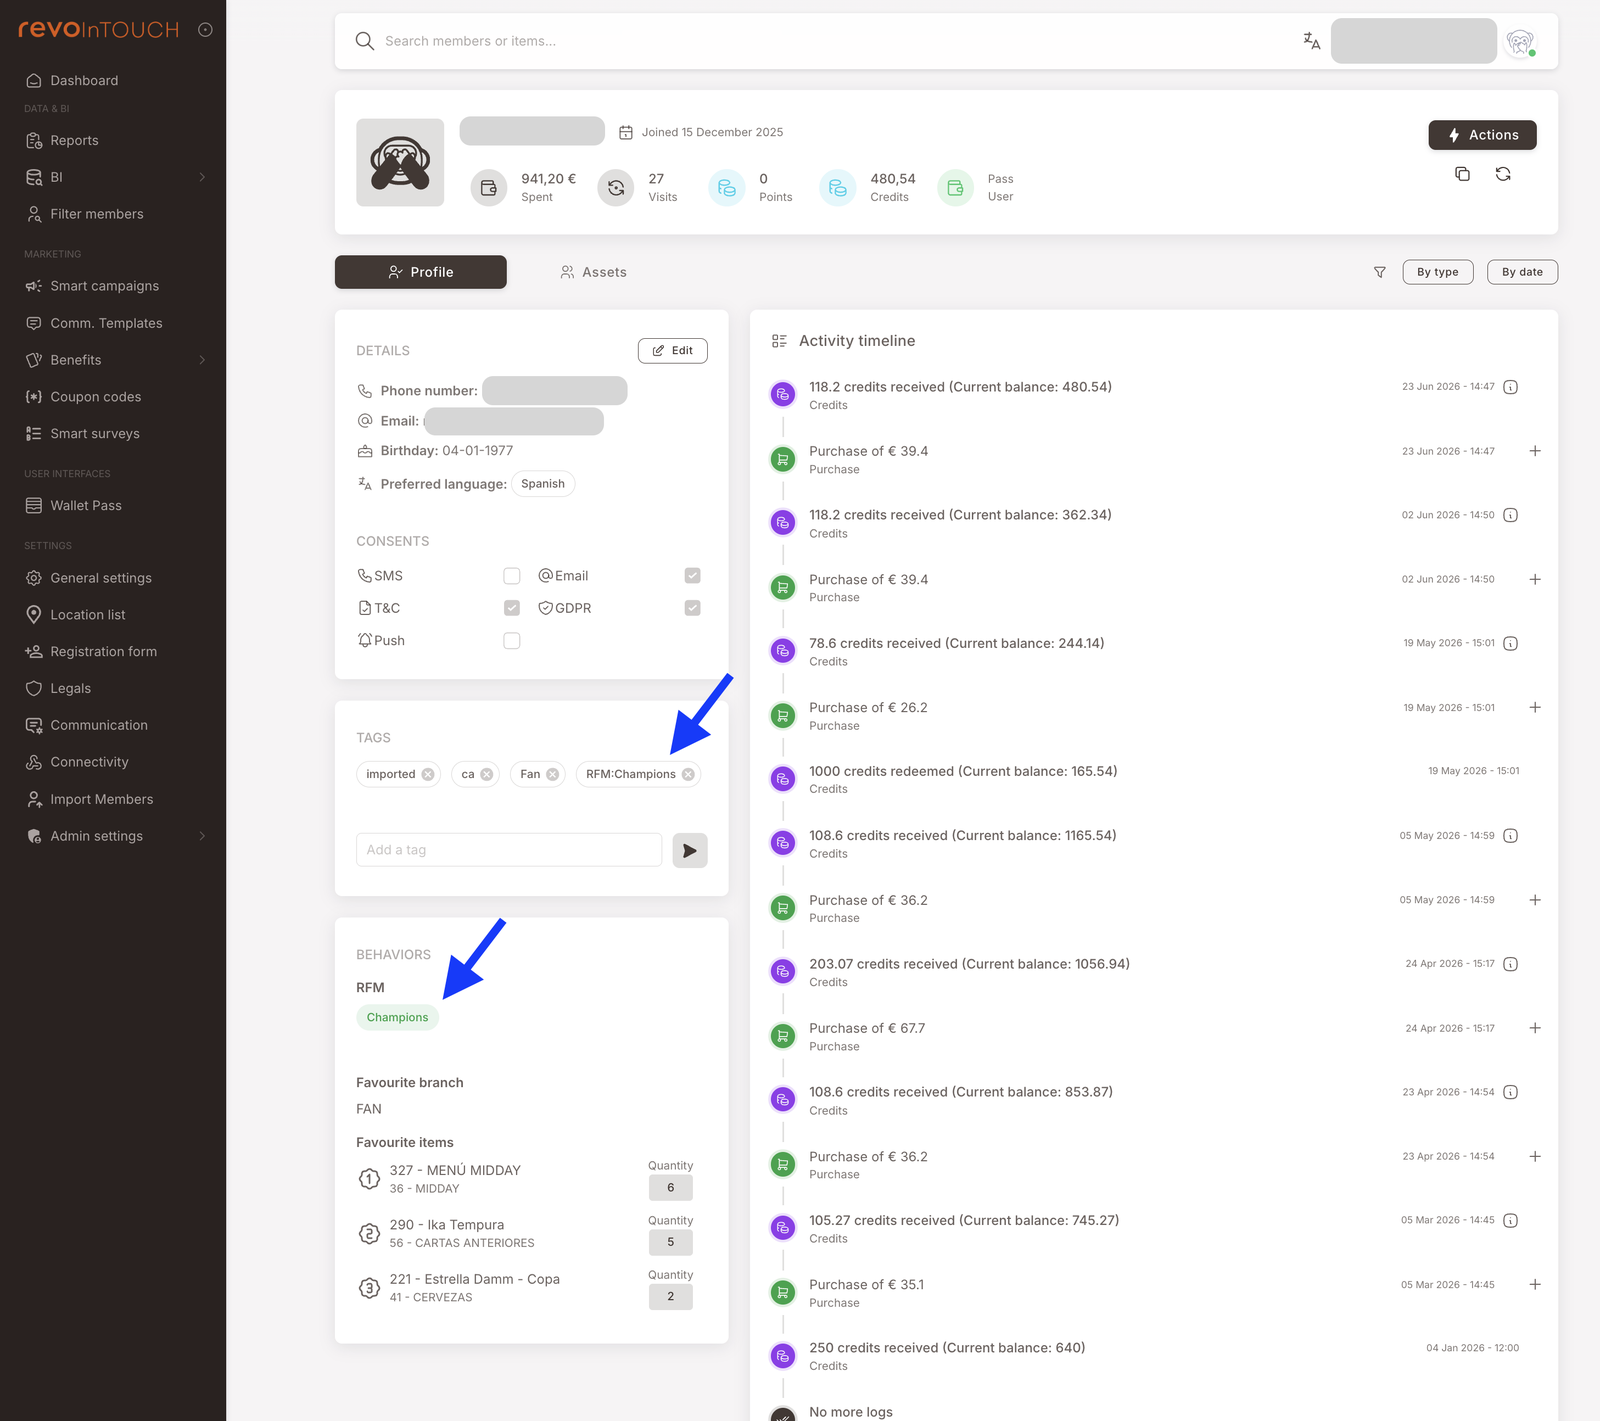
- Member profile — the segment shows in two places: as a tag (e.g.
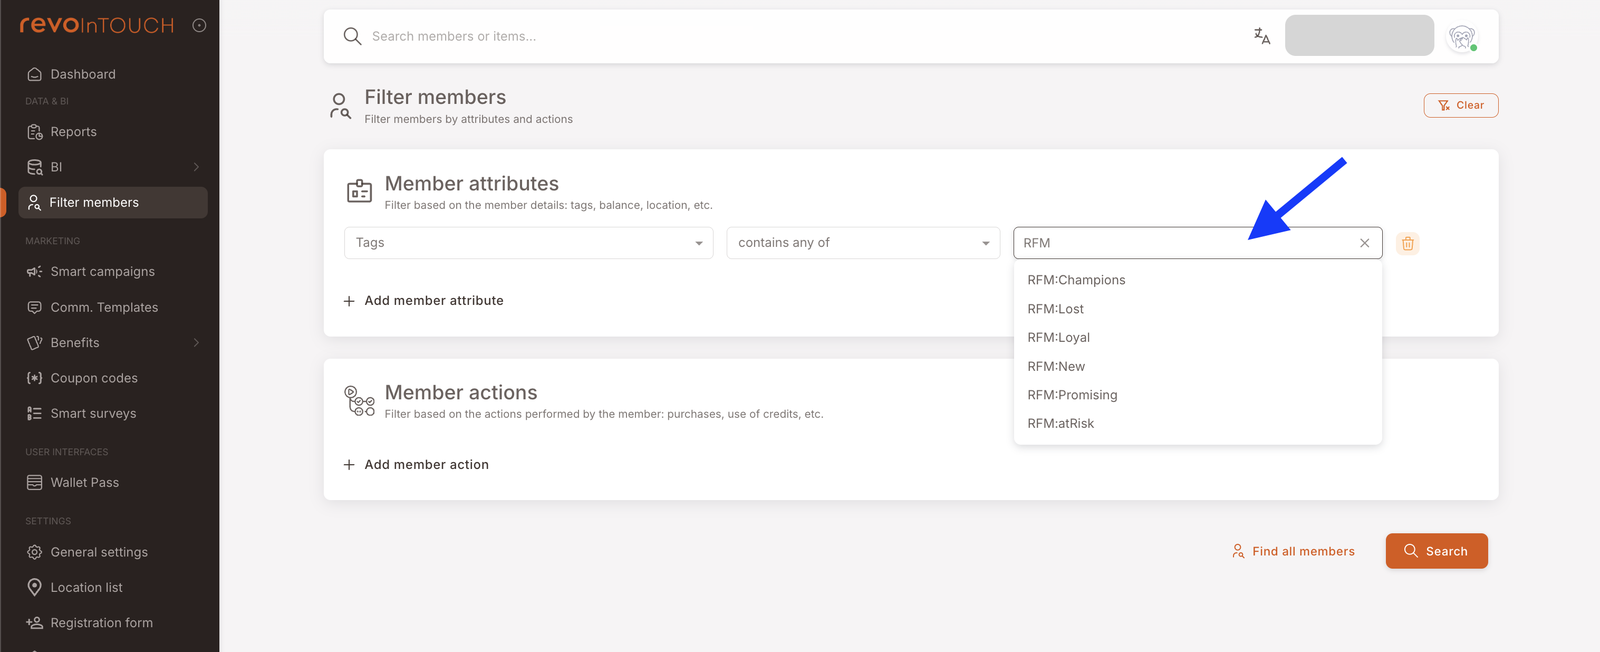
RFM:Champions) in the member's Tags panel, and as a coloured badge in the Behaviors panel, beside the member's favourite branch and favourite items. See Member profile. - Filter members — filter by the RFM tag: under Tags, pick
RFM:Champions,RFM:atRisk, and so on, then combine with branch or other tags to scope further — every Champion at Branch A, for example. See Filter members. - Smart Campaigns — every segment becomes an audience tag (
RFM:Champions,RFM:atRisk, and so on) you can pick in any campaign's audience step. Combine with other tags to scope further. See Smart Campaigns overview. - Dashboard and BI — segment distribution and revenue-per-segment widgets show the shape of your base at a glance. See Dashboard and BI.
On Filter members, the RFM tags appear under the Tags attribute, ready to pick with contains any of:
Common mistakes to avoid
- Treating segments as identity. A member who's Loyal today may be At Risk in three months and Champion in six. Always read the current segment, not the one you remember.
- Over-rewarding Champions. A Champion was going to come back anyway. Giving them an aggressive discount every month erodes margin without changing behaviour.
- Messaging Lost members on repeat. A single strong win-back is reasonable. A drip campaign to people who left a year ago is just annoying — and trains them to ignore you the next time you try.
- Reading the snapshot once a quarter. The whole point of the daily refresh is to act on movement between segments. If you only look once a quarter, you miss the window.
How segments are computed (briefly)
The platform looks at each member's loyalty activity over a lookback window of 6, 12 or 18 months, depending on your venue template and scores them on three dimensions:
- Recency — days since their last visit. Smaller is better.
- Frequency — number of visits in the lookback window. Bigger is better.
- Monetary — either total spend in the window or average ticket per visit, depending on your venue template.
Each score is relative to your own base — a high-spend member at a casual chain is not the same as a high-spend member at fine dining, and the platform compares each person against their peers in your brand only. The three scores combine into a segment using the venue template set up for your business (see Tuned to your kind of venue above).
In practice each score is a band within your own base: 3 is the best quarter of your scored members, 2 the middle half, 1 the bottom quarter. The bands are recalculated with every daily run, so the same number of visits can score differently as your base changes.
The full recompute runs once a day, overnight. Two segments are set by rule rather than by score: a member who joined more recently than the template's New period (30, 60 or 90 days) sits in New, and an older member with no visit at all inside the lookback window sits in Lost. The lookback window, spending measure, and venue template are all set for your business at launch.
Next steps
- New to RFM? Read The six segments next — one card per segment with what to do and what not to do.
- Want to act on segments? See the Smart Campaigns playbooks for ready-to-use templates.